These Energy Images about the commercialisation of hydrogen and fuel cells
and related topics have been created after careful research by:
Everyone is most welcome to use, forward and/or and reprint these Energy
Images for personal information, educational purposes and/or commercial
studies.
Please find the individual sources listed at the bottom of each
page/image. The figures were valid at the time of our research, however,
we are not liable for any missing facts which may no longer be accurate
due to the fast change of figures over the time.
| 1. Energy Balances |
| |
| 1.1 World Energy Balance |
| |
|
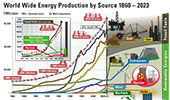 |
World Wide Energy Production by Source 1860 – 2023
|
| |
|
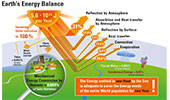 |
Earth's Energy Balance
The earth energy balance represents the balance between incoming energy from the Sun Sand thermal (longwave) and reflected (shortwave) energy from the Earth. The energy released from the Sun in one hour would be adequate to cover the energy needs of the entire world population for one year. |
| |
|
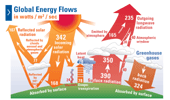 |
Global Energy Flows in watts / m2 / sec
Estimate of the Earth’s annual and global mean energy balance. Over the long term, the amount of incoming solar radiation absorbed by the Earth and atmosphere is balanced by the Earth and atmosphere releasing the same amount of outgoing longwave radiation. About half of the incoming solar radiation is absorbed by the Earth’s surface. |
| |
|
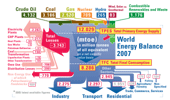 |
World Energy Balance 2007
Current energy systems are based on coal, oil, natural gas, and nuclear fission, depending on the circumstances in a given country and its access to today’s “cheapest”, not necessarily on the most viable, primary energy resources. 88 percent (!) of our energy supply in 2007 was from fossil or nuclear origin. |
| |
|
 |
World
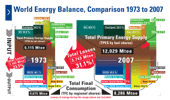
Energy Balance, Comparison 1973 to 2007
The total final consumption (TFC) worldwide grew from 4,675 Mtoe in 1973 to 8,286 Mtoe in 2007 with 88 percent derived from the combustion of fossil fuels and nuclear power. This is equivalent to an average power consumption rate of 96,349 terawatt-hours (TWh) in 2007. |
| |
|
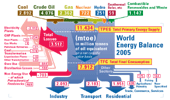 |
World Energy Balance 2005
This graphic presents the World Energy Balance of the year 2005 according
to a report edited by the International Energy Agency in its publication
"Key World Energy Statistics 2007"... |
| |
| 1.2 Energy Balance in Germany |
| |
|
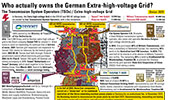 |
Who actually owns the German Extra-high-voltage Grid? |
| |
|
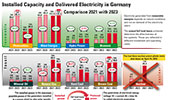 |
Installed capacity and delivered electricity volumes in Germany
Comparison 2021 with 2023
|
| |
|
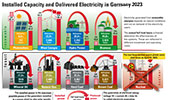 |
Installed capacity and delivered electricity volumes in Germany 2023
|
| |
|
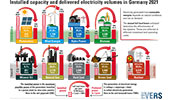 |
Installed capacity and delivered electricity volumes in Germany 2021
|
| |
|
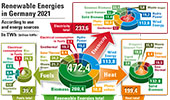 |
Renewable Energies in Germany 2021
|
| |
|
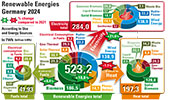 |
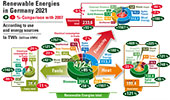
Renewable Energies in Germany 2024 - Comparison with 2021 |
| |
|
 |
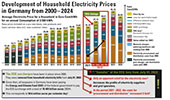
Renewable Energies in Germany 2021 - Comparison with 2007 |
| |
|
 |
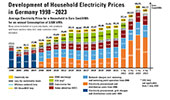
Development of household electricity prices in Germany 2000 – 2024 |
| |
|
 |
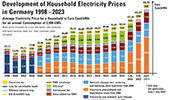
Development of household electricity prices in Germany 1998 – 2023 - update |
| |
|
 |
Development of household electricity prices in Germany 1998 – 2023 |
| |
|
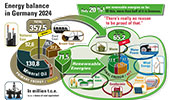 |
Energy Balance in Germany 2024 |
| |
|
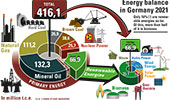 |
Energy Balance in Germany 2021 |
| |
|
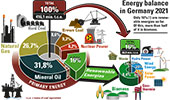 |
Energy Balance in Germany 2021 in Percent |
| |
|
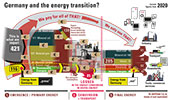 |
Germany and the energy transition? |
| |
|
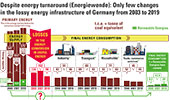 |
Despite energy turnaround (Energiewende): Only few changes in the lossy energy infrastructure of Germany from 2003 to 2019 |
| |
|
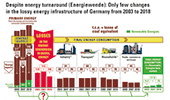 |
Despite energy turnaround (Energiewende): Only few changes in the lossy energy infrastructure of Germany from 2003 to 2018
Contrary to the allegations of the government and its subordinate authorities, since 2003 Germany has failed to comply with national and international commitments to save energy and reduce its environmental pollution obligations. |
| |
|
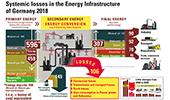 |
Systemic losses in the Energy Infrastructure of Germany 2018 |
| |
|
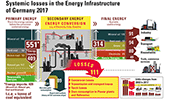 |
Systemic losses in the Energy Infrastructure of Germany 2017
In an energy balance, the generation, conversion and use of energy sources in a national economy for a certain period of time is proven as completely as possible and in detail. We have used the balance sheet created by the AG Energiebilanzen e.V. since 1995 as a basis for our own graphics.
|
| |
|
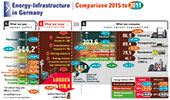 |
Energy-lnfrastructure in Germany Comparison 2015 to 2011 |
| |
|
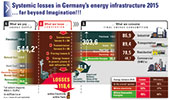 |
Data 2015:
Systemic losses in Germany's energy infrastructure ... far beyond Imagination!!!
The systemic losses in "our" German energy infrastructure are far greater, than most people can imagine or want to know. |
| |
|
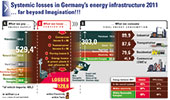 |
Data 2011:
Systemic losses in Germany's energy infrastructure ... far beyond Imagination!!!
The systemic losses in "our" German energy infrastructure are far greater, than most people can imagine or want to know. |
| |
|
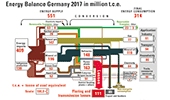 |
Energy Balance Germany 2017 |
| |
|
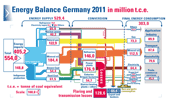 |
Energy Balance Germany 2011
|
| |
|
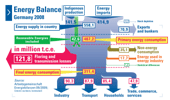 |
Energy Balance Germany 2008
This statistic shows the high amount of flaring and transmission losses, which are approx. 22 percent of the primary energy being produced in Germany in 2008. Should all the energy be used for the German industry alone be eliminated to ZERO, this still would save less than the flaring and transmission losses (90.3 compared to 121.8 t.c.e - Tonnes Coal Equivalents). |
| |
|
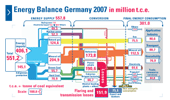 |
Energy Balance Germany 2007
For decades Germany’s autonomy has been put at risk through its dependence on other countries for its primary energy supply. In 2007, 84 percent of Germany’s primary energy was imported. Germany is, like many other countries, importing coal, crude oil, natural gas and uranium for nuclear energy. Coal / peat is by far the most used primary energy for the production of electricity in power plants. |
| |
|
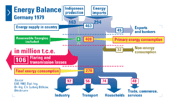 |
Energy Balance Germany 1979 - 2007
The graphs show the energy flow in Germany from the year 1979, created and published by Dipl.-Ing. Dr.-Ing. E.h. Ludwig Bölkow in his book, "Decisions for a long-term energy policy" (published 1982). |
| |
|
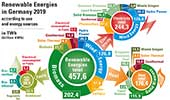 |
Renewable Energies in Germany 2019
We have analysed the current figures from the German Federal Environment Agency from 2019 for you. In relation to the total of 457.6 TWh (billion kWh) of renewable energies in Germany, wind energy and photovoltaic together make up only 37.9%, hydro-power 4.2%. |
| |
|
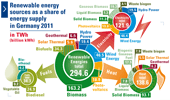 |
Renewable
energy sources as a share of energy supply in Germany
2011
|
| |
|
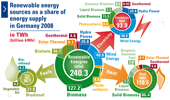 |
Renewable
energy sources as a share of energy supply in Germany
2008
The expansion of renewable energy sources in Germany continues undamped. Their share of the total final energy consumption has more than doubled since 2000, and now stands at 9.5 percent of the total final energy consumption or to be more precise: at 15.1 percent of the total electricity consumption, 7.7 percent of the heat and 5.9 percent of the fuel consumption. |
| |
|
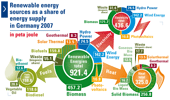 |
Renewable Energies in Germany 2007
According to estimates by the Association of Energy Balances e.V., the
primary energy consumption in Germany in 2007 accounted for 13,878
petajoules (PJ) and decreased by 4.8 percent compared to the previous
year... |
| |
|
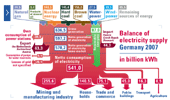 |
Balance of electricity supply Germany 2007
This energy image shows the energy consumption in Germany in the year 2007 as stated by the Association of Energy Balances e.V. The gross power generation of power plants was with approx 636.5 billion kWh similar to the one of 2006. The share of nuclear power with 140.5 billion kWh in the gross electricity production fell by 22.1% and dropped behind the shares of coals. Electricity generation from wind energy increased significantly by almost 29 % to 39.5 billion kWh... |
| |
|
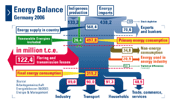 |
Energy Balance Germany 2006
This statistic shows the high amount of flaring and transmission losses, which are more than a quarter of the primary energy being produced in Germany alone and bought from other nations, being used inside Germany in 2006... |
| |
|
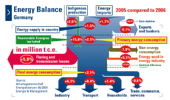 |
Energy Balance Germany 2005 compared to 2006
In 2006 the primary energy consumption increased by 2.5 percent to 497.8 million t.c.e. This can be seen in the Energy Balance 2006 for Germany from the Arbeitsgemeinschaft Energiebilanzen e.V. ... |
| |
|
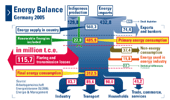 |
Energy Balance Germany 2005
This statistic shows the high amount of flaring and transmission losses, which are more than a quarter of the primary energy being produced in Germany alone and bought from other nations, being used inside Germany in 2005... |
| |
|
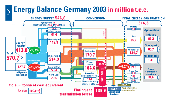 |
Energy
Balance Germany 2003 in million t.c.e. incl Comparison
to 2007
The graphic explains the energy flow in Germany in the year 2003, first
published by the Arbeitsgemeinschaft Energiebilanzen e.V. in 2004 ... |
| |
|
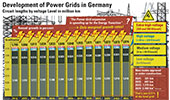 |
Development of Power Grids in Germany |
| |
|
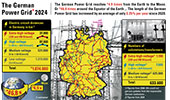 |
The German Power Grid 2024
|
| |
|
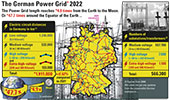 |
The German Power Grid 2022
|
| |
|
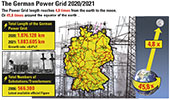 |
The German Power Grid 2020 /2021
|
| |
|
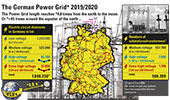 |
The German Power Grid 2019/2020
The German power grid has a total length of more than 1.8 million kilometers. This corresponds to 4.78 times the distance from the earth to the moon, or 45.8 times around the equator. It consists of four voltage levels. |
| |
|
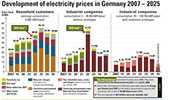 |
Development Electricity Prices Germany 2007-2025 |
| |
|
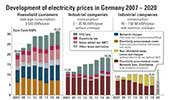 |
Development Electricity Prices Germany 2007-2020 |
| |
|
|
| 2. Production of hydrogen |
| |
|
|
2.1 Hydrogen from direct solar |
| |
|
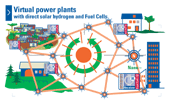 |
Virtual power plants with direct solar hydrogen and Fuel Cells
One possibility to produce hydrogen directly - without the use of electricity - is the direct use of solar energy, based on electrochemical photolysis... |
| |
|
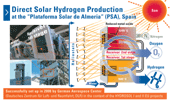 |
Direct Solar Hydrogen Production
at the “Plataforma Solar de Almeria“ (PSA)
In several research and development projects, over the years, various concepts from the laboratory processes to pilot-scale preparation have been created... |
| |
|
|
| 2.2 Hydrogen from renewable energies |
| |
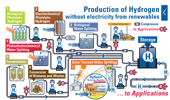 |
Production
of Hydrogen without electricity from renewables
Although a renewable energy source in conjunction with electrolysis would eliminate the dependence on fossil fuels, it still requires the production of electricity in the first place. The overall efficiencies of these processes are thereby reduced. Alternative methods without the need for electrical power include... |
| |
|
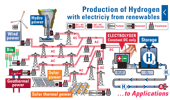 |
Production
of Hydrogen with electriciy from renewables
Electrolysis, which uses direct current electricity to separate hydrogen from water, could be a possible technology used to produce hydrogen entirely renewable and without pollution, but it requires the input of large amounts of electrical energy. To support this production of hydrogen from “green” electricity, still a grid of substantial length and power is needed... |
| |
|
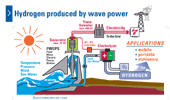 |
Hydrogen produced by wave power
Wave power is a form of renewable energy which refers to the energy of ocean surface waves. The power is determined by the water density, wave speed, length and height... |
| |
|
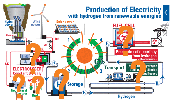 |
Production of Electricity with hydrogen from renewable energies
Today’s path to produce hydrogen, its distribution, storage and utilization is following the line of more or less conventional and known technologies... |
| |
|
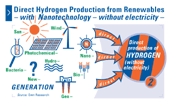 |
Direct Hydrogen Production from Renewables –
with Nanotechnology – without electricity
At the moment, all technologies are using electrolysers or reformers in order to produce the hydrogen to be used in the fuel cells for production of electricity... |
| |
|
 |
H2/FC Generation and Applications Process
In the future, direct production of Hydrogen - without electricity - by using renewable energies might be the only alternative to avoid all kinds of mechanical, transfer and electrical losses in the electrolysis process. |
| |
|
|
| 2.3 The Power of MagneGas™ |
| |
|
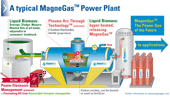 |
The Power of MagneGas™
Converting different Bio-Liquids to Renewable Power
Creating Convenience and Power Independence
In this new method, all forms of liquid biomass can be used to produce a hydrogen-based gas, wholly unique in its properties and efficiencies, but easier to handle than bio-liquids. As input, different sorts of liquid biomass can be used. Municipal sewage overflow or oil-based liquids are ideal candidates... |
| |
|
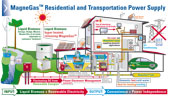 |
MagneGas™ Residential and Transportation Power Supply
A potential solution for our Residential and Transportation needs, creating Power independence and Convenienece ... |
| |
|
|
| 2.4 Hydrogen from fossil fuels |
| |
|
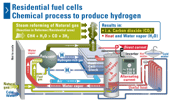 |
Residential
fuel cells
Chemical process to produce hydrogen
The idea sounds convincing: replace your standard gas boiler with a micro-CHP (combined heat and power) system based on fuel cell technology and be your own producer of clean heat, hot water and electricity... |
| |
|
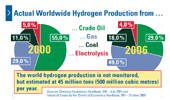 |
Actual Worldwide Hydrogen Production from …
The world hydrogen production is not monitored, but estimated at 45 million tons (500 million cubic metres) per year. Around 96 percent of it is derived from fossil fuels. |
| |
|
 |
State-of-the-Art Hydrogen Production
At the moment, all technologies are using either a reformer (reformation of natural gas, methanol and other hydrocarbons, gasification of coal, partial oxidation of heavy crude oil) or an electrolyser (electrolytic hydrogen from hydropower, hydrogen from nuclear energy)... |
| |
|
|
| 2.5 Hydrogen from nuclear energy |
| |
|
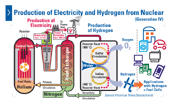 |
Production of Electricity and Hydrogen from Nuclear
Today there are more than 400 Nuclear Power Stations in daily use in 31 countries worldwide. They produce electricity rather conventional in steaming water with a very high C02 emission in the progress and unknown use of the nuclear waste after usage... |
| |
|
|
| 3. Production of electricity |
| |
|
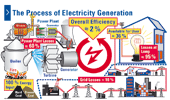 |
The Process of Electricity Generation
The process of electricity generation was already discovered in the mid-1800s, but its generation today is basically still the same process: Water is boiled by burning fossil fuels to produce steam which drives a turbine.... |
| |
|
|
| 3.1 Electricity from hydrogen |
| |
|
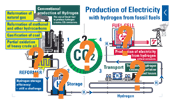 |
Production of Electricity with hydrogen from
fossil fuels
Today’s path to produce hydrogen, its distribution, storage and utilization is following the line of more or less conventional and known technologies. Starting from fossil fuels, like coal, natural gas or oil, hydrogen is produced by means of reformers... |
| |
|
|
| 3.2 Electricity from renewable energies |
| |
|
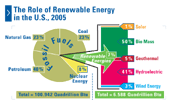 |
The Role of Renewable Energy in the U.S., 2005
According to a new report by the Energy Information Administration, the U.S. total consumption of energy stood at 100.942 Quadrillion Btu in 2005. |
| |
|
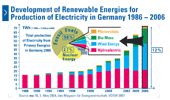 |
Development of Renewable Energies for
Production of Electricity in Germany 1986 - 2006
Fossil fuels represent the majority source for the production of electricity from primary energies in Germany, followed by nuclear energy... |
| |
|
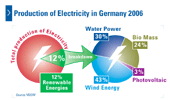 |
Production of Electricity in Germany 2006
The share of electricity produced from renewable energies in total electricity production in Germany added up to 12 percent in 2006... |
| |
|
 |
Scheme of a Solar Thermal Power Plant (STPP)
The Solar Thermal Power Plant (STPP) is a combination of a solar collector and a turbine. The solar collector produces steam from water (or other media) with a temperature level of about 290°C which is directly used in the turbine to generate electricity of max 27 kV. ... |
| |
|
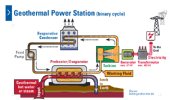 |
Geothermal Power Station (binary cycle)
In a binary cycle the hot geothermal water is passed through an heat exchanger, where its heat is transferred into a second (binary) liquid that boils at a lower temperature than water... |
| |
|
|
| 3.3 Electricity from fossil fuels |
| |
|
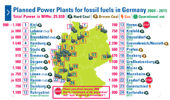 |
Planned Power Plants for fossil fuels in Germany
Demand for electricity has steadily risen to almost 570 million t.c.e (tonnes coal equivalents) in 2006 and is expected to continue to grow over the next decades. ... |
| |
|
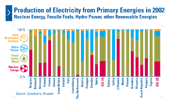 |
Production of Electricity from
Primary Energies in 2002
In 2002, fossil fuels represent the majority source for the production of electricity from primary energies in the EU-25 countries... |
| |
|
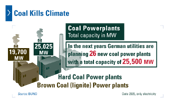 |
Coal Kills Climate
In the next years German utilities are planning 26 new coal power plants with a total capacity of 25,500 MW and the known side effects like the release of carbon dioxide, mercury and other pollutants... |
| |
|
|
| 3.4 Electricity from nuclear energy |
| |
|
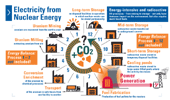 |
Electricity from Nuclear Energy
After the exploration process, uranium ore undergoes:
Uranium Mining:
The uranium ore is recovered from the earth’s crust... |
| |
|
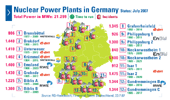 |
Nuclear Power Plants in Germany
Germany has 17 operating nuclear power plants with a total capacity of 21.299 MWe. In 2000, the German Government announced a compromise agreement on the eventual shut down of the nuclear power plants... |
| |
|
|
| 4. Hydrogen and Fuel Cells on their way to commercialisation |
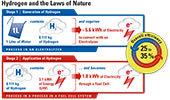 |
Hydrogen and the Laws of Nature |
| |
|
 |
Hydrogen
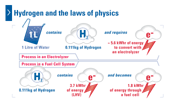
and the laws of physics
In an ideal system, 3.9 kWh of electricity and 1 liter of pure water are required to produce 0.111 kg of hydrogen. But typical commercial electrolyzer system efficiencies vary between 56 and 73 percent which corresponds to 70.1–53.4 kWh/kg or roughly 5.6 kWh for extracting 0.111 kg of hydrogen from 1 liter of water. |
| |
|
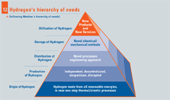 |
Hydrogen's hierarchy of needs
Abraham Maslow, an American psychologist, introduced his idea of a hierarchy of needs in his paper “A Theory of Human Motivation” which was published in 1943 and in his subsequent book “Motivation and Personality”. The hierarchy of needs suggests that people satisfy basic needs first before moving on to other needs... |
| |
|
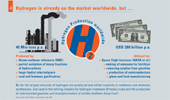 |
Hydrogen is already on the market worldwide, but ....
The world hydrogen production is not monitored, but estimated at 45 million tons (500 million cubic metres) per year, generating sales worth USD 28 billion p.a. Around 96 percent of it is derived from fossil fuels. It is mainly produced by steam methane reformers (SME), partial oxidation of heavy fractions of hydrocarbons, large (hydro) electrolyzers, coal and biomass gasification... |
| |
|
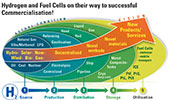 |
Hydrogen and Fuel Cells on their way to commercialisation
Today’s path to produce hydrogen, and their distribution, storage and utilization is following the line of more or less conventional and known technologies. Starting from primary energies like coal, fossil fuels, natural gas or wind energy, hydrogen is produced by means of electrolysers or reformers... |
| |
|
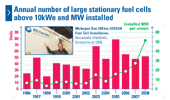 |
Annual number of large stationary fuel cells above 10kWe and MW installed
Large stationary fuel cells can be defined as units above 10kWe operating in grid tied or off grid operations, as CHP, CCP or in use as electricity generators... |
| |
|
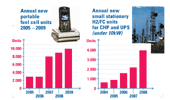 |
Annual new portable fuel cell units 2005 – 2009
Annual new small stationary H2/FC units for CHP and UPS (under 10kW)
Since year it has been stated that fuel cells have the potential to become the dominant technology for portable electronics. But reality is less exciting: “2008 saw around 9,000 units shipped in the portable fuel cell sector, a slight increase on 2007 but a lower rate of increase compared with 2006... |
| |
|
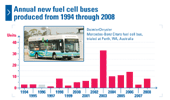 |
Annual new fuel cell buses produced from 1994 through 2008
The production of new fuel cell buses in the past five years is significantly lower than the units manufactured in 2003, when Daimler delivered its 33-bus fleet to the European CUTE and ECTOS and Australian STEP programmes. |
| |
|
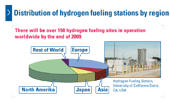 |
Distribution of hydrogen fueling stations by region
Fuel Cell Today projects that there will be over 150 hydrogen fueling stations in operation worldwide by the end of 2009. Most of them are in North America, followed by Europe, Japan and Asia. Only a miniscule quantity of hydrogen fueling stations is shared between the rest of the world... |
| |
|
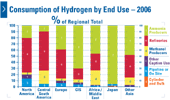 |
Consumption of Hydrogen by End Use – 2006
The graph published by SRI Consulting shows the consumption of hydrogen by region and end use in the year 2006. In North America, Central South America and Europe, most of the hydrogen is used at refineries to make reformulated gasoline. ... |
| |
|
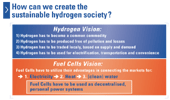 |
How can we create the sustainable hydrogen society?
In order to create a sustainable hydrogen society, hydrogen has to become a common commodity, must be produced free of pollution and losses, has to be traded global, based on supply and demand and must be used for electrification, transportation and convenience. ... |
| |
|
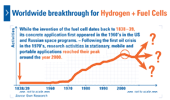 |
Worldwide breakthrough for
Hydrogen + Fuel Cells
While the invention of the fuel cell dates back to 1838-39, its concrete application first appeared in the 1960's in the US and Russian space programs. Following the first oil crisis in the 1970's, research activities in stationary, mobile and portable applications reached their peak around the year 2000... |
| |
|
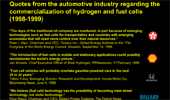 |
Quotes regarding the commercialization of hydrogen and fuel cells
(1998-2002)
"The introduction of fuel cells in mobile and stationary applications could possibly revolutionize the world's energy picture." ... |
| |
|
| 4.1. A proposal to future energy supplies Your Personal Power Provider (3P+) |
| |
|
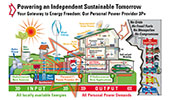 |
Power Up: Using Your Personal Power Provider 3P+
|
| |
|
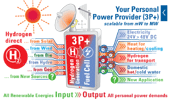 |
Your Personal Power Provider (3P+)
Today’s production of hydrogen, its distribution, storage and utilization are dependent upon conventional technologies, which are not commercial feasible at this time. All known technologies produce “black hydrogen” based on fossil fuels, rather than “green hydrogen” via direct solar energy ... |
| |
|
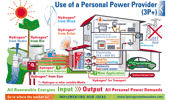 |
Use of a Personal Power Provider (3P+)
In order to create a sustainable hydrogen society, hydrogen has to become a common commodity: It must be produced directly in one conversation step from all “real renewable” primary energy sources... |
| |
|
 |
Global applications of Personal Power Providers (3P+)
Scientists, designers, engineers, craftsmen and people in education, administration, media and governmental positions, including politicians, - but also the final consumers - must be able to identify and overcome the obstacles in the bad efficiency of our existing electricity system... |
| |
|
| 4.2. Virtual Power Plant |
| |
|
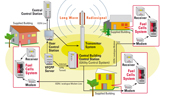 |
Virtual Power Plant
A virtual fuel cell power plant consist of a group of interconnected decentralized residential micro-CHPs (Combined Heat and Power Systems) which are installed in multi-family-houses, small enterprises, public facilities etc., for individual heating, cooling and electricity production. ... |
| |
|
| |
|
|
| 5. Four steps to a new Energy Supply |
| |
|
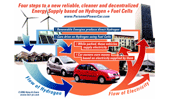 |
Four steps to a new reliable, cleaner and decentralized Energy Supply
based on
Hydrogen and Fuel Cells
Cars could be (or more pronounced: Cars have to be…) the key and the lead for a new energy supply based on H2/FC. All components to implement this idea are ready and available. All it takes is four steps... |
| |
|
|
| 5.1 Revolution in the garage |
| |
|
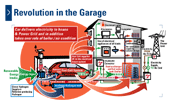 |
Revolution in the Garage
Looking at today’s so-called “western” countries, if all worldwide registered cars (more than 800 Mio in 2007) would be equipped with a fuel cell system, they could (all together) easily take over the function of all today’s existing stationary power plants... |
| |
|
|
| 5.2 The cars are the keys |
| |
|
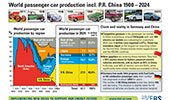 |
World passenger car production incl. P.R. China 1900 - 2024 |
| |
|
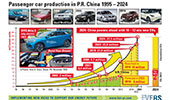 |
Passenger car production in P.R. China 1995 - 2024 |
| |
|
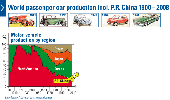 |
World passenger car production incl. P.R. China
The graphic of the global motor vehicle production from 1900 to 2008 shows that in the beginning, car production was shared between North America and Europe only. After 1950, other players appeared on the market like Japan and South Korea. China started their domestic car production in 1985. |
| |
|
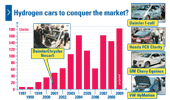 |
Hydrogen cars to conquer the market?
Hydrogen and fuel-cell cars are being tremendously promoted for a long time now. All the major automakers are working on them (Daimler f-cell, Honda FCX Clarity, GM Chevy Equinox, just to name a few) but none expect take-off until 2020 with production numbers in the low thousands at first... |
| |
|
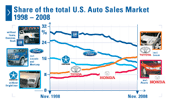 |
Share of the total U.S. Auto Sales Market 1998 – 2008
As shown by the data of the The Wall Street Journal, Toyota is on its way to overtake GM in its home market and to become the No. 1 car seller in the US... |
| |
|
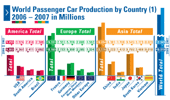 |
World Passenger Car Production by Country 2006 – 2007 in Millions
According to the International Organisation of Motor Vehicle Manufacturers (OICA), the global passenger car production in 2007 rose to almost 53 million units from 49.9 million the previous year, which corresponds to an increase of 6.3 percent... |
| |
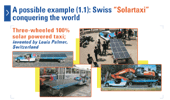 |
These examples show how solar powered transportation could conquer the world:
The solartaxi was invented by Louis Palmer from Switzerland. It is an electric vehicle with a five-meter long trailer covered by 6 square meters of high-energy 850 W solar cells. These solar cells produce enough electricity to run the taxi for up to 100 km a day... |
| |
|
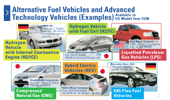 |
Alternative Fuel Vehicles and Advanced Technology Vehicles (Examples)
This graphic summarizes facts of Alternative Fuel Vehicles and Advanced Technology Vehicles based on their availability in 2008 in the car show rooms in the US... |
| |
|
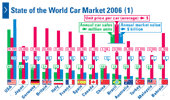 |
State of the World Car Market 2006
According to F1 Racing, USA's car sales occupy the commanding position in the world's car market 2006. Car sales stood by 16,6 million untis per year with an average price of roughly 28.300 US$ per car. ... |
| |
|
 |
Can 35 cars power one skyscraper?
This building shows a skyscraper in Singapore. On the photo next to the building are 35 cars, standing idle, a very typical situation world wide... |
| |
|
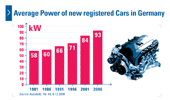 |
Average power of new registered cars in
Germany 1981-2006
The figures shown (from 58 kW in 1981 to 93 kW in 2006) are highlighting the increase in average engine-power of new registered cars in Germany over the years... |
| |
|
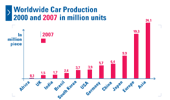 |
Worldwide Car Production 2000 and 2007 in million units
An analysis by the Sueddeutsche Zeitung and the International Organisation of Motor Vehicle Manufacturers (OICA) shows, that the biggest increase in the worldwide car production is in Asia, especially in China. |
| |
|
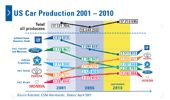 |
US Car Production 2001-2010
The major players currently operating in the US passenger car industry - such as General Motors, Ford, Chrysler, Toyota, and Honda – are facing opportunities and challenges in this dynamic industry... |
| |
|
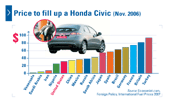 |
Price to fill up a Honda Civic
According to the Foreign Policy magazine, the price to filling up a Honda Civic varies hugely around the world – depending on subsidies and taxes... |
| |
|
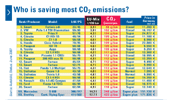 |
Who is saving most CO2 emissions?
Each year every car puts several tons of CO2 in the air. Therefore cuts in transport emissions and new technologies to reduce emissions are needed... |
| |
|
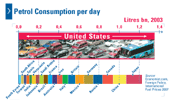 |
Petrol Consumption per day
According to the Foreign Policy magazine, the USA consumes nearly 1.4 billion liters petrol per day and is therefore the country with the most consumption... |
| |
|
|
| 6. Energizing the world |
| |
|
|
| 6.1 Energy Efficiency |
| |
|
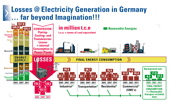 |
Losses @ Electricity Generation in Germany … far beyond Imagination!!! |
| |
|
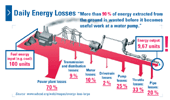 |
Daily Energy Losses
When you consider a “normal” electrical coal power plant, the counting of the efficiency only starts from the moment when the coal is at the venue of the plant... |
| |
|
 |
Daily Energy Losses by AC DC Adaptors
We all know them; they seem so inconspicuous. There a many of them in every household of the "Western" world. Mostly, except for the imprint "Made in China", they carry nothing more than little green or red LED lamps which shine when network-connection is available.... |
| |
|
 |
Energy effiency – one example
With every air-condition unit we install in a room or at a building, we not only cool our surroundings with a low efficiency but also heat our atmosphere with still unknown results. |
| |
|
|
| 6.2 Global Energy Consumption |
| |
|
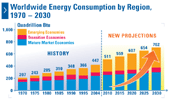 |
Worldwide Energy Consumption by Region, 1970 – 2030
According to the American Energy Information Administration (EIA) and to the International Energy Agency (IEA), the worldwide energy consumption will continue to increase by approx. 50 quadrillion btu every year... |
| |
|
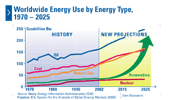 |
World Energy Use by Energy Type,
1970 - 2025
The consumption of worldwide energy use from all energy types is expected by the EIA (Energy Information Administration) - other sources come to similar figures... |
| |
|
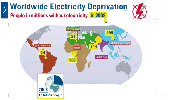 |
Electricity Deprivation
Based on the World Energy Outlook 2009, the International Energy Agency (IEA) estimates that in 2008 the number of people without access to electricity was 1.5 billion or 22 percent of the world’s population... |
| |
|
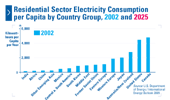 |
Residential Sector Electricity Consumption per Capita by Country Group, 2002 and 2025
According to the International Energy Outlook 2005, released by the Energy Information Administration (EIA), the worldwide consumption of electricity is expected to increase gradually... |
| |
|
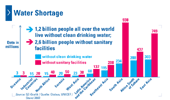 |
Water Shortage
1.2 billion people all over the world still live without clean drinking water and 2.6 billion people without sanitary facilities. |
| |
|
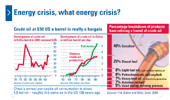 |
Energy crisis, what energy crisis?
The first graphic shows the development of crude oil in $ US a barrel from 1970 to 2003. The price of crude oil in 2003 is at its highest since 18 years, but 50 $ US a barrel it still is a bargain as the demand rises steadily at a worldwide scale... |
| |
|
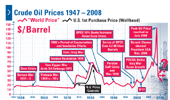 |
Crude Oil Prices 1947 – 2008
Crude oil prices behave much as any other article of trade with wide price
changes in times of shortage or oversupply. From 1947 to 1973 the crude
oil prices were quite stable, fluctuating between $US 14 and $US 18 a
barrel... |
| |
|
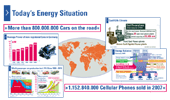 |
Today‘s Energy Situation
On the one hand, more than 800 million cars are registered on the road today and more than 1.15 billion cellular phones have been sold in 2007 worldwide. Both rates are still increasing and are just examples for a world which always wants to get bigger, faster, higher and more communicative. |
| |
|
|
| 6.3 Digital Technologies and Consumer Electronics |
 |
Cellular
boom in China
There is no doubt; the world’s largest mobile market is located in China. According to China’s Ministry of Industry and Information Technology (MIIT), in December 2008, there were 634 million Chinese mobile subscribers, served by only three carriers: China Mobile, China Unicom and China Telecom. |
| |
|
 |
Nokia Mobile Phones volumes
1984 - 2009
From out of nowhere, the Nokia Corporation, based in Espoo, Finland, has become a pioneer in the telecommunication market. In 2009 alone it has sold more than 432 million mobile phones (on average 1.2 million mobile phones per day) and held an estimated 39 percent share of the global device market... |
| |
|
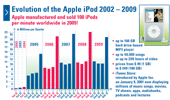 |
Evolution of the Apple iPod 2002 - 2009
The Apple iPod revolution that began in 2001 not only overturned the conventional way of listening to music, but affected people's entire life. On October 21, 2001 Apple Computer, Inc. from Cupertino, CA, USA, introduced its first 5 GB hard-drive based MP-3 player storing 1,000 songs with a battery life of 10 hours and a sales price tag of US$ 399... |
| |
|
 |
Evolution
of the Mobile Phone
1983-2005
As shown from the example (Dynetek mobile phone in 1983 vs. Sony Ericsson mobile phone in 2005) the progression of the telecommunications industry is immense... |
| |
|
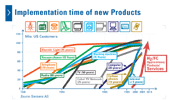 |
Implementation
time of new Products
The future of an H2/FC economy will not be dependent on the replacement of existing energy-powered products, but rather in new products and/or new services unknown today... |
| |
|
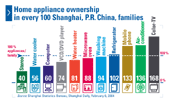 |
Home
appliance ownership
in every 100 Shanghai, P.R.China, families
The Chinese economy grew fast in recent years and so did the income and lifestyle of Chinese people. As showed by the Shanghai Statistics Bureau, Shanghai Daily, the average Shanghai family owns most of the modern home appliances introduced by the western world... |
| |
|
 |
Available Solar Chargers
An estimated number of 1.1 billion cellular phones will be sold in 2007, the annual production rate is still increasing... |
| |
|
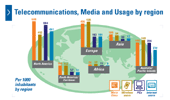 |
Telecommunications,
Media
and Usage by region
In the beginning telephones, mobiles, PCs and the internet were exotic, heavy and expensive status symbols. But size and weight reduction, affordable, reliable, and universal inventions... |
| |
|
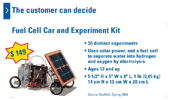 |
The
customer can decide
FC Car and Experiment Kit – cost $149 USD. This kit can be used for various important experiments, like measuring current, efficiency, etc. They have regrettably, no payload, no range, or anything “useful” for daily life... |
| |
|
| 6.4 Exampl. from Aircraft/Mining Industries |
| |
|
 |
35 Locomotives can not fly! /
Evolution in the Aircraft Industry 1903 - 2007
In 1903, 35 locomotives with a weight of 16 tonnes each could in fact not fly. However when you compare the Wright’s Flyer with today’s Airbus A380 over the past 104 years, big changes took place, both in services, daily usage, technology and infrastructure... |
| |
|
| |
|
|
| 6.5 Electricity Prices in USA, Germany, and Europe |
| |
|
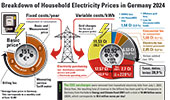 |
Breakdown of Household Electricity Prices in Germany 2024
|
| |
|
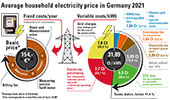 |
Average household electricity price in Germany 2021
|
| |
|
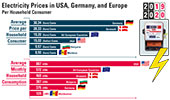 |
Electricity Prices in USA, Germany, and Europe
Per Household Consumer
A lot of people talk about electrification. And a lot of things should suddenly be operated electrically,
including heating houses, offices or apartments, which once used to be frowned upon.
|
| |
|
|
| 7 The 15 biggest global players |
| |
|
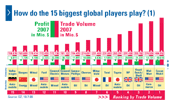 |
The 15 biggest global players #1 Year 2007
According to the Sueddeutsche Zeitung, in 2007 the 15 biggest global players – ranked by trade volume - are more or less the same companies from the same industries as in the year 2006... |
| |
|
 |
The 15 biggest global players #2 Year 2007
From 2006 to 2007, the biggest winners in terms of trade volume are the Asian companies, while the trade volume of German and American companies degrade (with the German automobile company as an exception)... |
| |
|
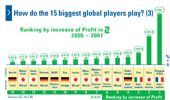 |
The 15 biggest global players #3 Year 2007
Europe's second-biggest carmaker (after Volkswagen) and the world's sixth-largest carmaker in terms of vehicle production had the sharpest increase in profits compared to 2006, followed by Sony and two more European automobile makers... |
| |
|
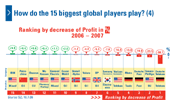 |
The 15 biggest global players #4 Year 2007
According to the Sueddeutsche Zeitung, in 2007 the 15 biggest global players – ranked by trade volume - are more or less the same companies from the same industries as in the year 2006... |
| |
|
| |
|
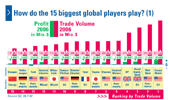 |
The 15 biggest global players #1 Year 2006
According to the Sueddeutsche Zeitung, the 15 biggest global players – ranked by trade volume - are not a mixed bunch of industries. There’s a weighting towards oil companies like Exxon Mobil... |
| |
|
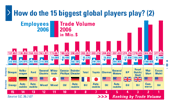 |
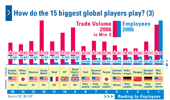
The 15 biggest global players #2 Year 2006
The sector with the highest average number of employees is the commerce sector followed by the automobile industry... |
| |
|
 |
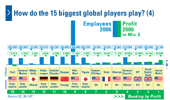
The 15 biggest global players #3 Year 2006
Wal-Mart (commerce sector) shows a phenomenal level in both revenue and employees, making it the number one in the ranking by employees/ trade volume... |
| |
|
 |
The 15 biggest global players #4 Year 2006
Average profits per employee were highest for the oil sector with up to 100.000 employees. These figures should be compared with the result and the hard work of millions of SME (small and medium sized enterprises)... |
| |
|
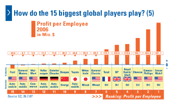 |
The 15 biggest global players #5 Year 2006
The oil sector had the highest average profits per employee of all global players whilst the automobile sector is scored poorly. |
