 |
|
|
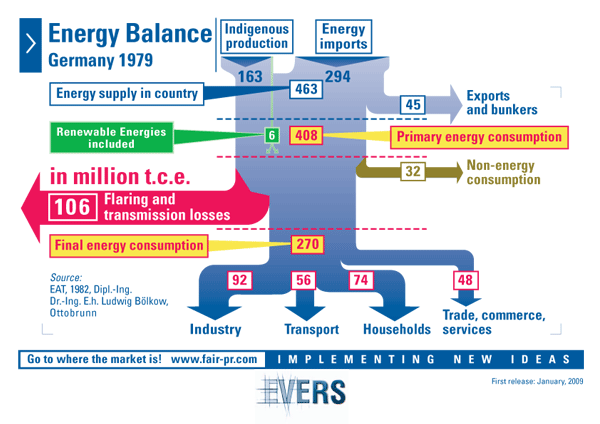
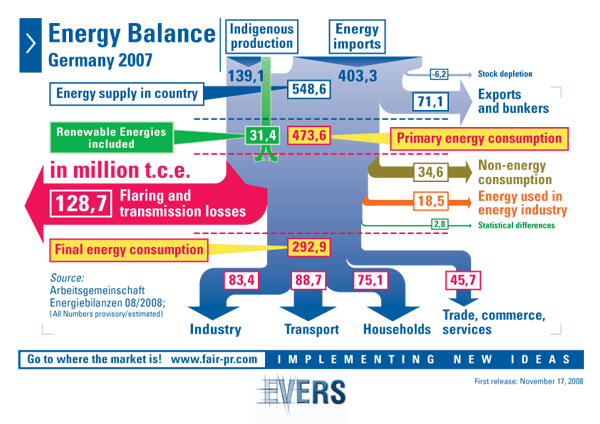
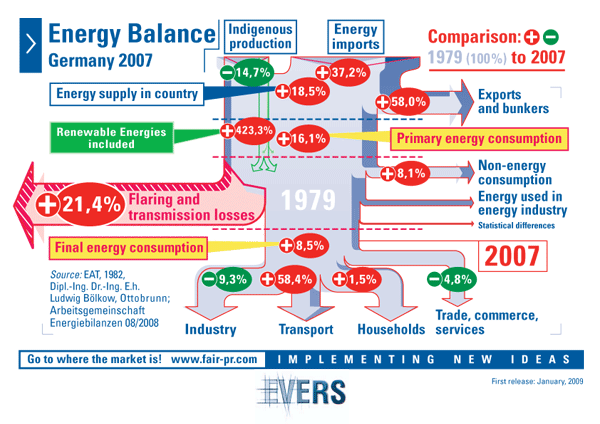
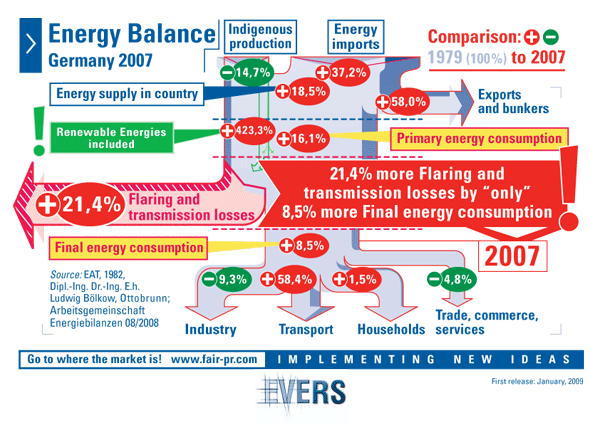
Energy Balance Germany 1979 - 2007 The graphs show the energy flow in Germany from the year 1979, created and published by Dipl.-Ing. Dr.-Ing. E.h. Ludwig Bölkow in his book, "Decisions for a long-term energy policy" (published 1982). In 1979, the primary energy in Germany (which is the consumption of raw materials, coal, oil, gas, uranium and hydroelectric power) amounted to 408 million tonnes of coal equivalent (tce). When converting the above mentioned raw materials, into for the consumer usable forms of energy such as gasoline and electricity, conversion losses occurred in the amount of 106 million tce. After deduction of non-consumption (raw materials, which are not used for energy, but for products such as plastics and chemicals), there were only 270 million tce left for the end user: just 67 percent of the primary energy. Of these, 92 million tonnes are used in industry, 74 million tonnes in the households, followed by transport with 56 million tonnes and trade / services with 48 million tonnes tce. In his book, Dr. Ludwig Bölkow points out that 50 percent of the final energy is consumed for the production of hot water and heating which could be easily reduced by means of building insulation, heat recovery, etc. Really utilized energy (mechanical work, driving, heat, etc.) account for only slightly more than 30 percent of the energy. The rest is referred to as conversion losses or is lost as unused energy. What has changed with the ever-evolving, energy-efficient technology since 1979 until 2007? Nothing! Despite all the political assurances, to increase the energy efficiency in Germany, this did not happen. On the contrary, the situation described above has become even worse. The population has increased from 78.2 million by 5.1 percent to 82.2 million. The primary energy consumption increased by 16.1 percent, but instead of raising up domestic production (-14.7 percent) more raw materials (+37.2 per cent) were imported. The share of renewable energy rose by a significant 423 per cent, but only because its proportion in 1979 (with 6 million tonnes tce) was vanishingly small. At the time, these were the shares of hydropower for electricity generation and ever growing energies (wood) for heat. The conversion losses, which are mainly the losses in the production of electricity in central power plants and the losses during the transport of electricity, have increased in the last 28 years by remarkable 21.4 percent, although the consumption only rose by 8.5 percent. Anyone who speaks of energy savings, and so do many, should be the first to start with the conversion losses, which raise from year to year, and are higher than the total energy consumed in the transport sector (1979: conversion losses = 106 million tons tce ; traffic = 74 million tons, 2007: conversion losses = 128.7 million tons tce; traffic = 88.7 million tons). It should also be noted that in the figures of the time frame from 1979 to 2007 all further losses caused by the consumption or the use of energy by industry, transport, etc. are not even considered. (Sources: EAT, 1982, Dipl.-Ing. Dr.-Ing. Eh Ludwig Bölkow, Ottobrunn; Arbeitsgemeinschaft Energiebilanzen 08/2008)
|


